Multiple Choice
The following diagrams show the production possibilities boundaries for Austria and Switzerland,for the production of bicycles and shoes. 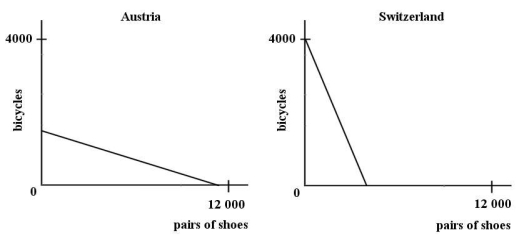 FIGURE 32-2 Refer to Figure 32-2.The diagrams illustrate that Switzerland
Identify the types of welfare benefits and their calculation, including means-tested and contributory benefits.
Grasp the changes and motivations behind welfare policies and reforms since the 1990s.
Understand the concept of forced savings programs and the difference between Medicare and Medicaid.
Recognize the role of federal legislation in shaping welfare and educational policies.
Definitions:
Related Questions
Q1: The economy in the diagram below begins
Q4: Which of the following scenarios is an
Q9: Consider the AD/AS model with a constant
Q48: The table below shows government purchases (G),net
Q54: _ are the talents possessed by a
Q62: Suppose a 10% tariff on all wines
Q65: A store manager observes that his team
Q67: The table below shows government purchases (G),net
Q84: Which of the following is a common
Q90: The diagram below shows the domestic demand