The diagram below shows the budget deficit function for a government in a hypothetical economy. 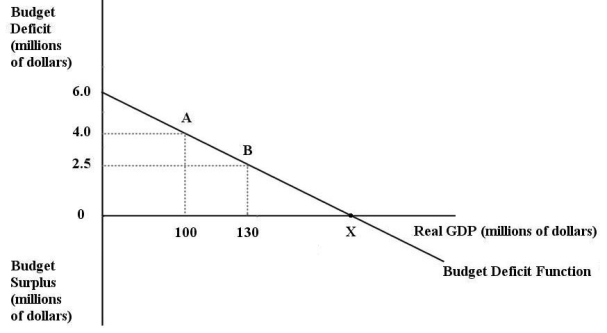 FIGURE 31-1 Refer to Figure 31-1.Initially,suppose real GDP is $100 million and the budget deficit is $4 million,as shown by point A on the graph.Which of the following is consistent with a move from point A to point B?
Definitions:
Short-Run Phillips Curve
The Short-Run Phillips Curve depicts an inverse relationship between unemployment and inflation in the short term, indicating that lower unemployment can come with higher inflation.
Monetary Policy
The process by which a government, central bank, or monetary authority manages the money supply to achieve specific goals, such as controlling inflation, maintaining employment, and stabilizing the currency.
Short-Run Phillips Curve
A curve that illustrates a short-term trade-off between inflation and unemployment, suggesting lower unemployment can come at the cost of higher inflation.
Financial Crisis
A broad term for a situation when financial assets rapidly lose a significant part of their nominal value.
Q26: Consider the market-clearing theory of the labour
Q35: The table below provides hypothetical unemployment,employment,and labour
Q64: The Bank of Canada's formal policy target
Q77: Which of the following describes the cause
Q91: Consider Canada's balance of payments.Suppose Canada's current
Q99: The diagram below shows supply and demand
Q100: Suppose Canada implements new border procedures that
Q117: Consider the balance-of-payments accounting information for Lalaland
Q117: Consider a bond that promises to make
Q141: Other things being equal,if the Canadian dollar