The three figures below show the phases of a disinflation.In part (i) ,the economy is experiencing a sustained inflation at E1. 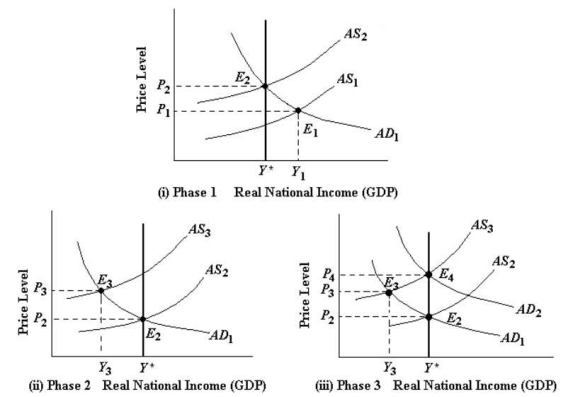 FIGURE 29-4 Refer to Figure 29-4,part (iii) .The movement of the economy from E3 to E4 in Phase 3 is often caused by
Definitions:
Conversion Costs
Costs incurred to convert raw materials into finished products, usually comprising direct labor and manufacturing overhead.
Total Materials Costs
The total expense incurred for materials used in the production of goods, including direct and indirect materials.
Equivalent Units
A concept in costing that converts partially completed goods into a number of completed units, facilitating cost calculation.
Conversion Costs
Costs that are incurred to convert raw materials into finished goods, typically including direct labor and manufacturing overhead.
Q2: In general,the sacrifice ratio will be greater,the<br>A)shorter
Q7: Suppose the actual overnight interest rate is
Q38: The Bank of Canada initially implements a
Q63: Consider two countries that can produce rice
Q64: When real GDP is greater than potential
Q75: With regard to national income,what is the
Q90: The data below provides the Actual and
Q97: Consider a new deposit of $100 000
Q110: Consider a country that is initially autarkic
Q112: Suppose the NAIRU for Canada is 6.5%,the