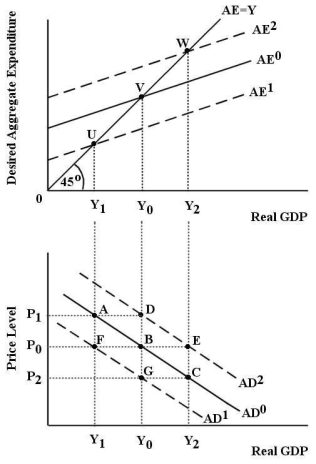
 FIGURE 23-1 Refer to Figure 23-1.Assume the economy is initially in equilibrium with desired aggregate expenditure equal to real GDP at point V.The price level is P0.Now,suppose the AE curve shifts to AE2 and we move to a new equilibrium level of GDP at Y2 and point E on AD2.A possible cause of this change in equilibrium is
Definitions:
Monetary Policy
The process by which a central bank controls the supply of money in an economy, often targeting interest rates to promote economic stability.
Fiscal Policy
A government's use of spending and taxation to influence the economy.
Aggregate Demand
The aggregate requirement for products and services in an economy at a specific general price point during a certain time frame.
Money Demand Curve
A graphical representation showing the relationship between the interest rate and the quantity of money that people want to hold.
Q40: Consider the circular flow of income and
Q49: Consider the long-run theory of investment,saving,and growth.Suppose
Q54: If the short-run macroeconomic equilibrium occurs with
Q66: The table below shows total output for
Q90: The table below shows data for five
Q99: Consider the following aggregate expenditure function: AE
Q111: The currency that is in circulation in
Q113: The "value added" for an individual firm
Q122: What is the focus of study in
Q145: Consider the basic AD/AS macro model in