The diagram below shows desired aggregate expenditure for a hypothetical economy.Assume the following features of this economy: • marginal propensity to consume (mpc) = 0.75
• net tax rate (t) = 0.20
• no foreign trade
• fixed price level
• all expenditure and income figures are in billions of dollars. 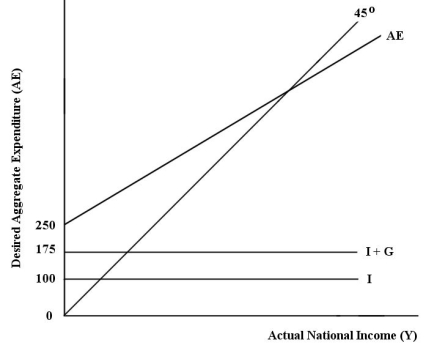 FIGURE 22-2
Refer to Figure 22-2.Which of the following equations describes the aggregate expenditure function for this economy?
Definitions:
Coupons
Promotional tools offering discounts or special deals on products or services, usually with an expiration date to encourage prompt usage.
Games of Chance
Activities or games where the outcome is strongly influenced by random factors or luck.
Sweepstakes
A type of contest or promotional drawing where winners are selected randomly from entries to receive prizes, often used for marketing purposes.
Contests
A promotional strategy involving prize giveaways where participants compete by performing a task under specified conditions.
Q32: Consider the following news headline: "Information technology
Q44: Consider the basic AD/AS macro model in
Q51: On a graph that shows the derivation
Q65: Consider the AD/AS model.In the long run,after
Q74: Which of the following correctly describes the
Q87: One reason that real GDP tends to
Q88: An equivalent term for "real national income"
Q93: Suppose disposable income for an entire economy
Q94: With regard to national-income accounting,which of the
Q137: When would we expect to see undesired