The diagram below shows desired aggregate expenditure for a hypothetical economy.Assume the following features of this economy: • marginal propensity to consume (mpc) = 0.80
• net tax rate (t) = 0.15
• no foreign trade
• fixed price level
• all expenditure and income figures are in billions of dollars. 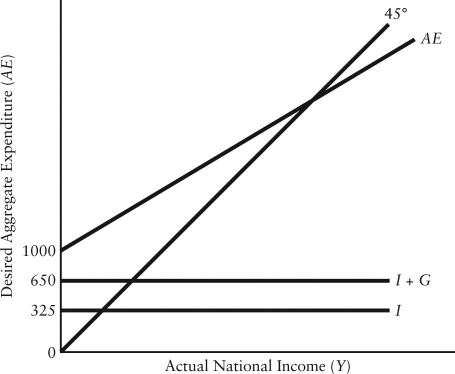 FIGURE 22-3
Refer to Figure 22-3.Which of the following equations describes the aggregate expenditure function for this economy?
Definitions:
Significance Level
The threshold below which the p-value of a statistical test must fall for the result to be considered statistically significant, often denoted as alpha (α).
Market Share
It represents the portion of a market controlled by a particular company or product, expressed as a percentage of the total market volume.
Heavy Advertising Campaign
A strategic marketing effort that involves a significant increase in advertising volume and intensity to promote a product, service, or brand.
Chi-squared Goodness-of-fit Test
A statistical test used to determine if observed data fits an expected distribution.
Q6: "Demand" in a particular market refers to<br>A)only
Q9: The table below provides macroeconomic data for
Q14: If 0.75 U.S.dollars can be exchanged for
Q26: The three main reasons that Canada's real
Q55: Suppose a Canadian firm imports $1000 worth
Q65: Statistics Canada excludes from GDP the value
Q74: <img src="https://d2lvgg3v3hfg70.cloudfront.net/TB7713/.jpg" alt=" FIGURE 20-1 Refer
Q108: How is Canada's unemployment rate determined?<br>A)The rate
Q127: Consider a simple macro model with a
Q153: Consider the following information describing a closed