The diagram below shows desired aggregate expenditure for a hypothetical economy.Assume the following features of this economy: • marginal propensity to consume (mpc) = 0.80
• net tax rate (t) = 0.15
• no foreign trade
• fixed price level
• all expenditure and income figures are in billions of dollars. 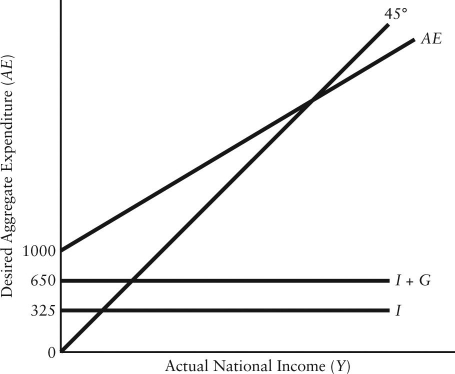 FIGURE 22-3
Refer to Figure 22-3.What is the level of autonomous consumption?
Definitions:
Q47: Consider a simple macro model with a
Q47: The table below shows total output for
Q49: Which of the following best describes the
Q55: In the Neoclassical growth model,if capital and
Q57: Desired consumption divided by disposable income is
Q75: If the economy is in macroeconomic equilibrium
Q87: In macroeconomics,the term "national income" refers to<br>A)all
Q87: Consider the basic AD/AS macro model in
Q99: If the price level is taken as
Q114: Consider a model in which output is