The table below shows hypothetical data for volumes of e-books and hardcover books sold over a 3-year period in a particular city. 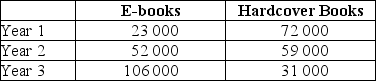 TABLE 2-3 Refer to Table 2-3.Suppose we choose Year 1 as the base year and construct a series of index numbers with which to analyze sales data.The index numbers for volumes of hardcover books sold (starting with Year 1) is
Definitions:
Q3: To calculate GDP from the income side,one
Q10: It is important for policymakers to recognize
Q16: Fact Finding and Analysis is the first
Q23: Behaviour in free-market economies is<br>A)determined by a
Q31: The table below shows the approximate value
Q42: When members of a group disagree over
Q65: When an issue is not very important
Q71: The table below includes data for a
Q82: Groups should ignore the fact that members
Q138: Suppose that supply for some good increases