Multiple Choice
Below,the graph on the left shows long-run average and marginal cost for a typical firm in a perfectly competitive industry.The graph on the right shows demand and long-run supply for an increasing-cost industry. 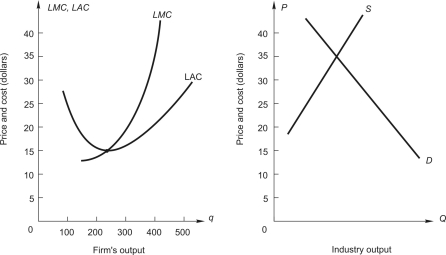 How much profit will the firm earn?
Definitions:
Related Questions
Q2: When demand is elastic,<br>A)marginal revenue is negative.<br>B)the
Q17: Based on the following graph,what is the
Q17: When marginal revenue is zero,<br>A)P < MR.<br>B)P
Q33: In the following graph,the price of capital
Q33: The market demand for a monopoly
Q50: A firm is considering the decision
Q50: In the following graph the price of
Q53: Suppose that the firm's only variable input
Q68: A profit-maximizing firm with market power will
Q88: In a perfectly competitive market<br>A)a firm must