In the following graph the consumer's income is $1,200.At point B, 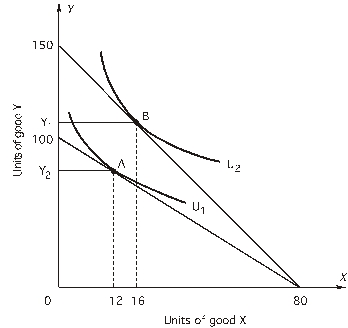
Definitions:
Rational Consumer
A consumer who systematically and logically evaluates available options to maximize their satisfaction or utility in decision-making processes.
Marginal Utility
The surplus enjoyment or utility obtained from the consumption of one extra unit of a good or service.
Budget Line
A line that shows the different combinations of two products a consumer can purchase with a specific money income, given the products’ prices.
Marginal Utility
The additional satisfaction or utility a consumer gets from consuming one more unit of a good or service.
Q11: The marginal product of labor<br>A)measures how output
Q14: <img src="https://d2lvgg3v3hfg70.cloudfront.net/TB7882/.jpg" alt=" In the figure above,what
Q14: Refer to the following graph.The price of
Q41: In the following graph,the price of capital
Q42: A student taking economics,statistics,and finance has decided
Q45: In the following graph the price
Q63: Barack Obama<br>A)was the Alaska governor and Tea
Q82: During the 1980s, the U.S. economy shifted
Q89: Did American foreign policy change significantly when
Q89: Use the following table to answer