The figure below shows a consumer maximizing utility at two different prices (the left panel) and the consumer's demand for good X at the same two prices of good X (the right panel) .The price of good Y is $14.At point r on indifference curve I,the MRS is _____ and _____ units of good X are purchased. 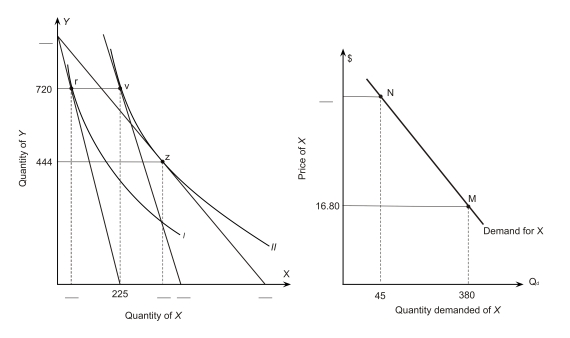
Definitions:
Optimal Size
Optimal size is the most efficient scale of operation for a firm where it can minimize its cost and maximize its profitability.
Synergy
The concept that the combined value and performance of two companies will be greater than the sum of the separate individual parts.
Net Present Value
The difference between the present value of cash inflows and the present value of cash outflows over a period of time, used in capital budgeting to assess the profitability of an investment.
Firm Value
The total market value of a company's equity plus its debt, reflecting the overall worth of the company.
Q10: If the marginal rate of technical substitution
Q20: Straker Industries estimated its short-run costs
Q25: Refer to the following graph to answer
Q31: A short-run production function was estimated
Q32: Possible problems with consumer interviews include:<br>A)a non-random
Q57: The following linear demand specification is
Q74: Given the table below,what is the
Q79: In the following graph the price of
Q83: If there are no fixed costs in
Q86: In the following graph,the price of capital