The figure below shows a consumer maximizing utility at two different prices (the left panel) and the consumer's demand for good X at the same two prices of good X (the right panel) .The price of good Y is $4.50.At point B on indifference curve I,the MRS is _____ and _____ units of good X are purchased. 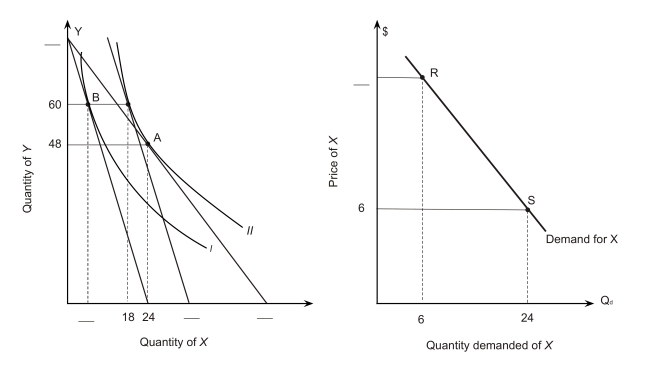
Definitions:
Q1: Use the following general linear supply
Q7: A firm estimates its long-run production
Q8: A government agency is having problems
Q9: Which of the following is NOT a
Q14: In 2008, presidential candidate Barack Obama presented
Q24: What was the fundamental source of instability
Q38: Arguably the MOST controversial element of the
Q41: In the following graph,the price of capital
Q70: In the graph below,the price of capital
Q90: Assume that an individual consumes two