Use the graphs in Figures 29.4 and 29.5 and the following information when answering the corresponding questions.
Canadian and Swiss researchers van der Heijden et al., 1998) interested in factors affecting biodiversity, grew a variety of gra plants in combination with one of four arbuscular mycorrhizal AMF) species, no AMF, or all four AMF species together; and measured plant growth under each set of conditions. All plant species were grown in each plot, so they always competed with each other with the only difference being which AMF were present. Use the graphs in Figure 31.5 to answer the questions
that follow. Note that the x- axis labels indicate the number and identity of AMF species bar 0 = no fungi; bars A- D = individual AMF species; bar A+B+C+D = all AMF species together) . The y- axis indicates the amount grams) of plant biomass for the species shown in italics above each graph. Graph e) is the total biomass grams) of all 11 plant species combined; graph f) is the biomass of Bromus erectus plants only, separated from the total.
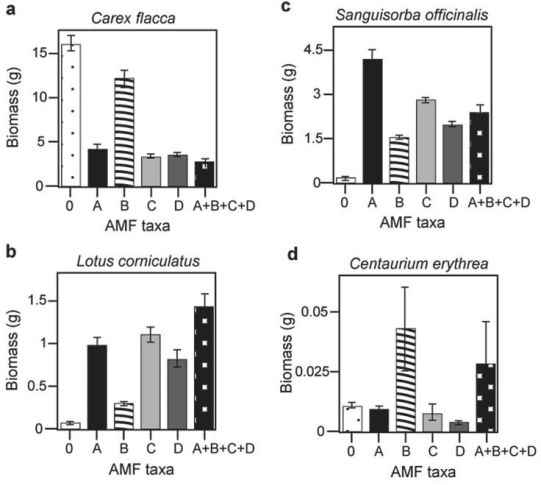 Figure 29.4
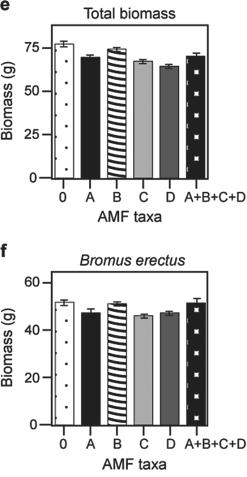 Figure 29.5
-What is the major difference between Bromus erectus graph f) and the other plant species graphs a- d) included in the study?
Definitions:
Amoral
Amoral describes actions or individuals that are neutral in terms of morality, lacking a sense of right or wrong.
Mintzberg's Managerial Roles
A framework that categorizes ten roles managers typically perform, including interpersonal, informational, and decisional roles.
Conceptual Skill
The ability to analyze and solve complex problems.
Persuasiveness
The ability to convince others to accept a certain viewpoint, idea, or action through reasoning or argument.
Q2: Full induction of the lac operon occurs
Q7: One way to detect alternative splicing of
Q11: Which of the following observations about flagella
Q14: What do Bacteria have in common with
Q23: The presence of a lophophore in a
Q25: How would you expect the root system
Q29: The common ancestor of the protostomes had
Q30: The Bicoid gene product is normally localized
Q31: Which of the following experiments is able
Q31: Which tissue type, or organ, is not