TABLE 16-13
A local store developed a multiplicative time-series model to forecast its revenues in future quarters, using quarterly data on its revenues during the 4-year period from 2005 to 2009. The following is the resulting regression equation:

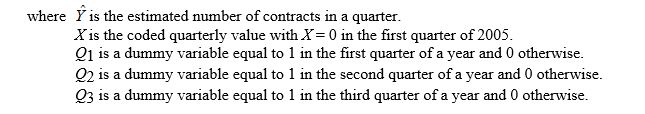
-Referring to Table 16-13, the best interpretation of the coefficient of Q2 (-0.054) in the regression equation is:
Definitions:
Total Cost
The sum of fixed and variable costs used in producing goods or services.
Product Price
The amount of money charged for a good or service, determined by various factors including production costs, market demand, and competition.
Marginal Cost
The elevation in aggregate expenditure associated with creating an additional unit of a product or service.
Economic Profit
The difference between total revenue and total costs, including both explicit and implicit costs, reflecting the total gains from undertaking an economic activity.
Q5: The logarithm transformation can be used<br>A) to
Q9: How is plant cell cytokinesis different from
Q43: Referring to Table 17-5, the best estimate
Q47: An investor wanted to forecast the price
Q55: The coefficient of multiple determination measures the
Q84: Referring to Table 15-4, the null hypothesis
Q100: Referring to Table 15-5, the error appears
Q130: Referring to Table 14-15, the null hypothesis
Q164: Referring to Table 13-2, what is the
Q165: A regression had the following results: SST