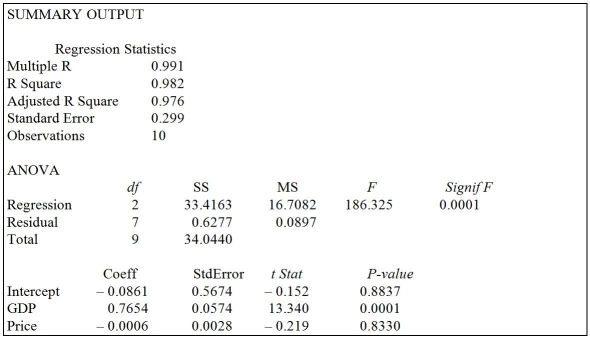
TABLE 14-3
An economist is interested to see how consumption for an economy (in $ billions) is influenced by gross domestic product ($ billions) and aggregate price (consumer price index) .The Microsoft Excel output of this regression is partially reproduced below. 
-Referring to Table 14-3,when the economist used a simple linear regression model with consumption as the dependent variable and GDP as the independent variable,he obtained an r2 value of 0.971.What additional percentage of the total variation of consumption has been explained by including aggregate prices in the multiple regression?
Definitions:
Mass Customization
A manufacturing technique that combines the flexibility and personalization of custom-made products with the low unit costs associated with mass production.
Mass Production
The manufacture of large quantities of standardized products, often using assembly lines or automated technologies, to achieve economies of scale.
Ford's Strategy
Refers to the business strategies implemented by the Ford Motor Company, often focusing on manufacturing innovations, market positioning, and sustainability efforts.
Broadband Fiber-Optic
A high-speed internet access technology that transmits data through light signals over fiber optic cables, offering faster speeds compared to traditional broadband.
Q17: Which of the following sequences correctly represents
Q25: Referring to Table 15-1, what is the
Q26: Referring to Table 17-8, an <img src="https://d2lvgg3v3hfg70.cloudfront.net/TB4634/.jpg"
Q31: Referring to Table 16-7, the number of
Q35: Referring to Table 14-15, the null hypothesis
Q44: Referring to Table 17-1, what is the
Q53: Referring to Table 14-15, the alternative hypothesis
Q129: Referring to Table 16-1, set up a
Q141: Referring to Table 13-12, what are the
Q193: The slope (b<sub>1</sub>) represents<br>A) predicted value of