TABLE 14-5
A microeconomist wants to determine how corporate sales are influenced by capital and wage spending by companies. She proceeds to randomly select 26 large corporations and record information in millions of dollars. The Microsoft Excel output below shows results of this multiple regression. 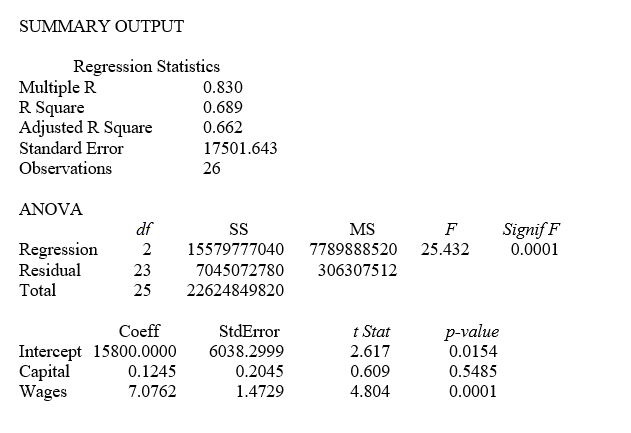
-Referring to Table 14-5, one company in the sample had sales of $20 billion (Sales = 20,000) . This company spent $300 million on capital and $700 million on wages. What is the residual (in millions of dollars) for this data point?
Definitions:
Q5: Referring to Table 14-7, the department head
Q12: Referring to Table 14-10, to test the
Q46: A regression had the following results: SST
Q64: A regression had the following results: SST
Q73: Referring to Table 14-15, which of the
Q75: The interpretation of the slope is different
Q107: Referring to Table 14-15, what are the
Q113: Referring to Table 16-9, the fitted exponential
Q127: Referring to Table 16-4 and using a
Q133: If the Durbin-Watson statistic has a value