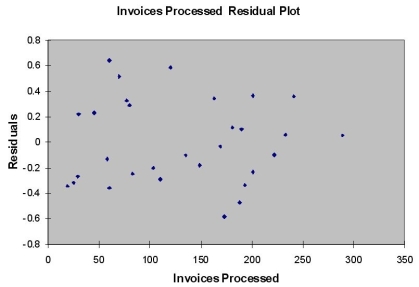
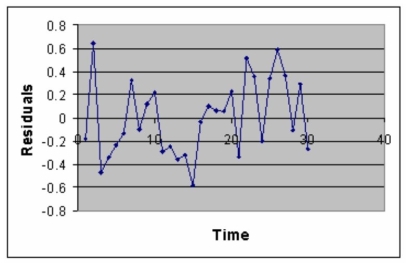
TABLE 13-12
The manager of the purchasing department of a large banking organization would like to develop a model to predict the amount of time (measured in hours) it takes to process invoices. Data are collected from a sample of 30 days, and the number of invoices processed and completion time in hours is recorded. Below is the regression output:
 Note: 4.3946E-15 is 4.3946×10⁻¹⁵


-Referring to Table 13-12, the estimated average amount of time it takes to process one additional invoice is
Definitions:
Q4: Referring to Table 13-11, the normality of
Q19: Referring to Table 15-2, is the overall
Q20: When testing H<sub>0</sub> : π<sub>1</sub> - π<sub>2</sub>
Q27: Referring to Table 12-13, what is the
Q30: Referring to Table 14-15, we can conclude
Q51: Referring to Table 11-8, the among-group variation
Q52: Referring to Table 14-4, what minimum annual
Q55: Referring to Table 12-9, what is the
Q74: The least squares method minimizes which of
Q183: Referring to Table 14-2, for these data,