TABLE 13-12
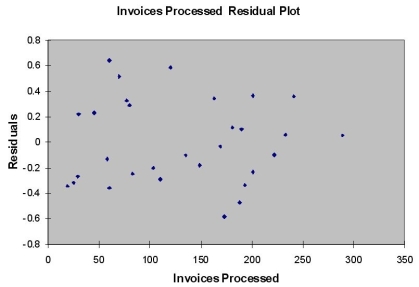
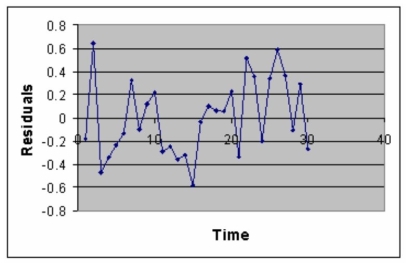
The manager of the purchasing department of a large banking organization would like to develop a model to predict the amount of time (measured in hours) it takes to process invoices. Data are collected from a sample of 30 days, and the number of invoices processed and completion time in hours is recorded. Below is the regression output:
 Note: 4.3946E-15 is 4.3946×10⁻¹⁵
-Referring to Table 13-12, the degrees of freedom for the t test on whether the number of invoices processed affects the amount of time are
Definitions:
Null Hypothesis
A default hypothesis that there is no significant difference or effect, often to be tested against an alternative hypothesis.
Sample Size
Refers to the quantity of participants or observations used in a statistical analysis.
P-value
A statistical measure that helps researchers determine the significance of their results, indicating the probability of observing their results if the null hypothesis were true.
One-sample T Test
A statistical test used to determine whether a sample mean significantly differs from a known or hypothesized population mean.
Q7: Referring to Table 14-4, which of the
Q20: The procedure for the Wilcoxon rank sum
Q31: Referring to Table 10-5, what is the
Q37: Referring to Table 13-3, the director of
Q51: Referring to Table 14-5, what are the
Q54: Referring to Table 13-12, predict the amount
Q68: Referring to Table 10-11, if the firm
Q89: The value of r is always positive.
Q160: Referring to Table 13-7, to test whether
Q172: Referring to Table 12-7, the expected cell