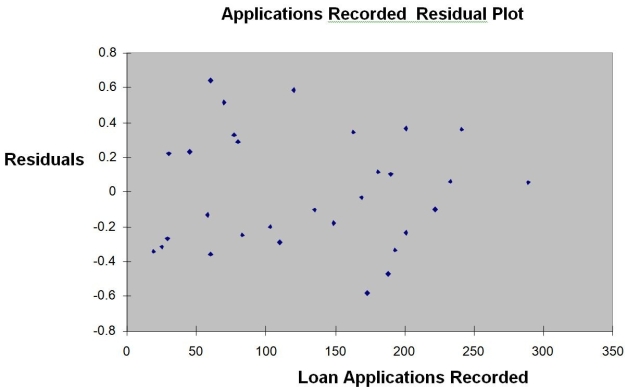
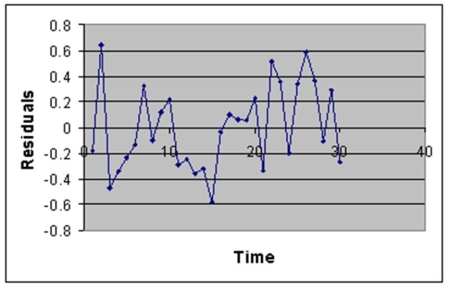
TABLE 13-12
The manager of the purchasing department of a large saving and loan organization would like to develop a model to predict the amount of time (measured in hours) it takes to record a loan application. Data are collected from a sample of 30 days, and the number of applications recorded and completion time in hours is recorded. Below is the regression output:
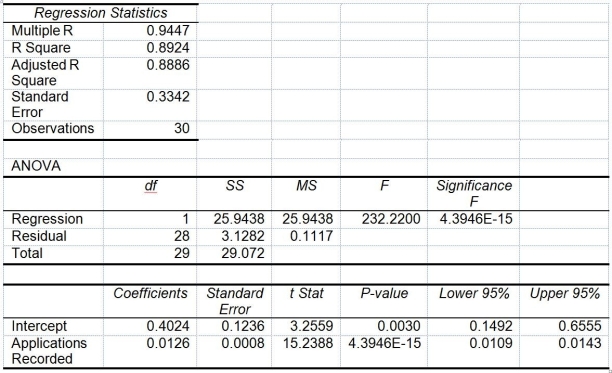
Note: 4.3946E-15 is 4.3946 ×

-Referring to Table 13-12, there is no evidence of positive autocorrelation if the Durbin-Watson test statistic is found to be 1.78.
Definitions:
Recognizing
The process of formally recording or incorporating an item into the financial statements of an entity.
Current Assets
Current Assets are assets that are expected to be converted into cash, sold, or consumed within one year or within a company’s operating cycle if longer than a year.
Accounts Receivable Turnover
A financial ratio indicating how many times a company's accounts receivable are collected during a specific period.
Net Sales
The amount of sales generated by a company after deducting returns, allowances for damaged or missing goods, and any discounts allowed.
Q7: Referring to Table 14-4, which of the
Q12: Referring to Table 14-10, to test the
Q35: Referring to Table 10-5, the calculated value
Q40: Referring to Table 13-9, the 90% confidence
Q66: Referring to Table 15-5, there is enough
Q106: Referring to Table 10-11, what is the
Q107: Referring to Table 14-15, what are the
Q134: The coefficient of multiple determination r<sup>2</sup><sub>Y</sub><sub>.12</sub><br>A) measures
Q136: Referring to Table 14-5, which of the
Q159: Referring to Table 14-3, the p-value for