TABLE 3-8
The time period from 2006 to 2009 saw a great deal of volatility in the value of stocks. The data in the following table represent the total rate of return of our companies from 2006 to 2009.
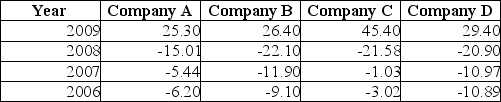
-Referring to Table 3-8, calculate the geometric mean rate of return for Company C.
Definitions:
Adjusting Process
The method of updating account balances at the end of an accounting period to reflect accurate financial positions.
Financial Statements
Financial statements are formal records of the financial activities and condition of a business, person, or other entity, providing an overview of a financial situation over a specified period.
Matching Principle
An accounting principle that requires expenses to be recorded and recognized in the same period as the revenues they helped to generate.
Expenses
Costs incurred in the normal course of business to generate revenues, including costs such as rent, salaries, and utility expenses.
Q4: The rate of return for Microsoft's stock
Q6: Referring to Table 2-5, what percentage of
Q27: Referring to Table 4-10, if a randomly
Q30: Referring to Table 3-4, the standard deviation
Q31: The portion of the universe that has
Q32: The Quality Assurance Department of a large
Q55: Which of the following is an advantage
Q113: Referring to Table 2-14, construct a cumulative
Q137: Referring to Table 4-9, is the size
Q195: When polygons or histograms are constructed, which