TABLE 2-4
Every spring semester, the School of Business coordinates with local business leaders a luncheon for graduating seniors, their families, and friends. Corporate sponsorship pays for the lunches of each of the seniors, but students have to purchase tickets to cover the cost of lunches served to guests they bring with them. The following histogram represents the attendance at the senior luncheon, where X is the number of guests each graduating senior invited to the luncheon and f is the number of graduating seniors in each category.
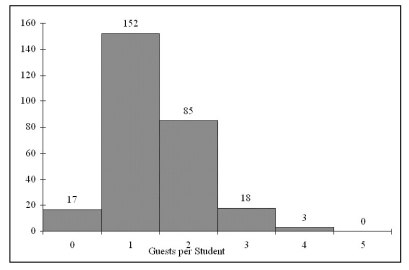
-Referring to the histogram from Table 2-4, how many graduating seniors attended the luncheon?
Definitions:
Q17: Referring to Table 5-1, the probability that
Q38: Which group of microorganisms is most likely
Q44: If P(A and<br>B) = 0, then A
Q49: You were told that the 1st, 2nd,
Q54: Referring to Table 2-15, if the sample
Q55: Which of the following pairs is mismatched?<br>A)
Q57: If X has a binomial distribution with
Q61: The number of 911 calls in Butte,
Q100: Referring to Table 2-6, if 100 calls
Q239: Referring to Table 2-6, if 10 calls