TABLE 2-4
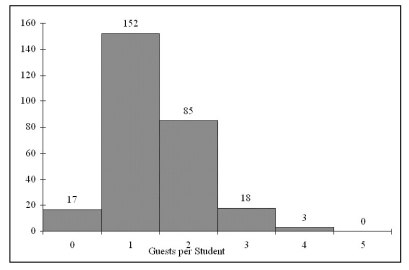
Every spring semester, the School of Business coordinates with local business leaders a luncheon for graduating seniors, their families, and friends. Corporate sponsorship pays for the lunches of each of the seniors, but students have to purchase tickets to cover the cost of lunches served to guests they bring with them. The following histogram represents the attendance at the senior luncheon, where X is the number of guests each graduating senior invited to the luncheon and f is the number of graduating seniors in each category.
-When constructing charts, the following is plotted at the class midpoints:
Definitions:
Level Shift
A sudden, lasting change in the time series data that can significantly affect the data's trend, usually detected through statistical analysis.
Cycle
In the context of data analysis, a period or sequence of events that repeats regularly.
Trend
The general direction in which something is developing or changing over time.
Control Chart
A graphical tool used in process control to display how a process changes over time, highlighting whether the process stays within predetermined control limits.
Q4: In Figure 8.5, which model of the
Q22: Referring to Table 4-8, if a randomly
Q24: Mediterranean fruit flies were discovered in California
Q24: Referring to Table 4-1, what proportion of
Q25: The British Airways Internet site provides a
Q35: Suppose A and B are events where
Q40: Referring to Table 4-6, if a randomly
Q71: In a contingency table, the number of
Q120: Referring to Table 2-15, of the females
Q156: Referring to Table 5-2, the probability that