Figure 4-9 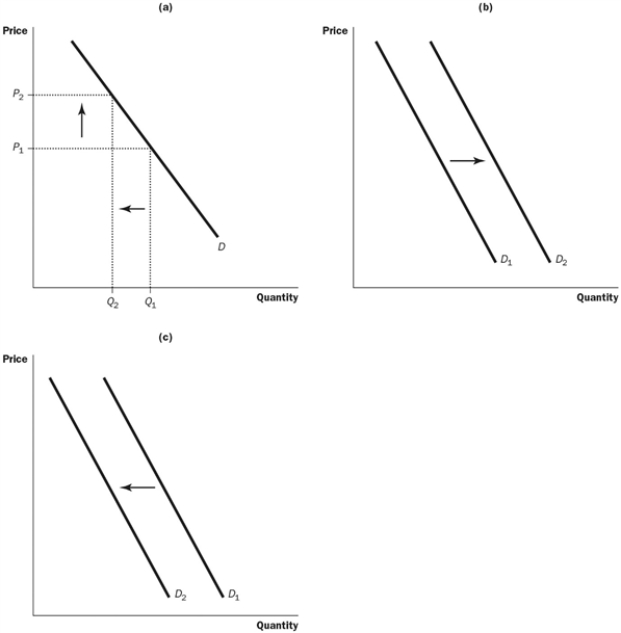
-Refer to the Figure 4-9. Which graph could be used to show the result of 5 percent of the country's smokers deciding to stop smoking?
Definitions:
Market Entry
The process by which a new competitor enters an existing market, often involving overcoming barriers to entry.
AVC
Average Variable Cost, which is the total variable costs of production divided by the quantity of output produced.
Economic Profits
Profits calculated by subtracting both explicit and implicit costs from revenue; also known as supernormal profits.
Q11: In ten years, when you are the
Q48: Which statement best defines "indexation"?<br>A) It is
Q57: Why are historical episodes valuable to economists?<br>A)
Q72: The producer who has the smaller opportunity
Q93: Some civil society groups and activists propose
Q97: Technological innovations, by increasing productivity in manufacturing,
Q104: If the productivity slowdown had not occurred
Q123: Refer to Table 3-5. If Japan and
Q128: What does "substitution bias" in the consumer
Q172: Mark is a computer company executive and