Multiple Choice
Figure 3-5
These graphs illustrate the production possibilities available for dancing shoes to Fred and Ginger with 40 hours of labour. 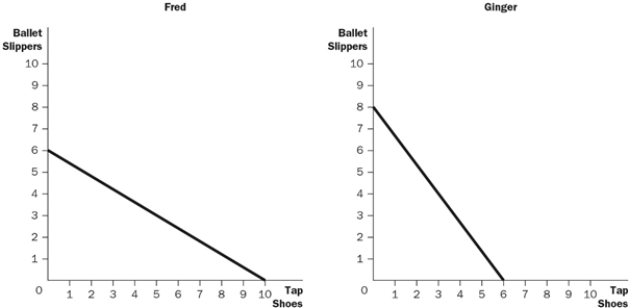
-Refer to Figure 3-5. What is the opportunity cost of one pair of tap shoes for Fred?
Definitions:
Related Questions
Q15: What does microeconomics study?<br>A) the behaviour of
Q31: Refer to Figure 3-6. What is the
Q31: Which month of the year has an
Q56: What does trade NOT achieve?<br>A) increased competition<br>B)
Q62: Suppose there is an earthquake that destroys
Q152: Once the demand curve for a product
Q153: Which of the following determines a market
Q188: After much consideration, you have chosen Cancun
Q190: Henry decides to spend two hours swimming
Q245: Refer to the Figure 4-3. In this