Multiple Choice
The figure below shows a family of cost curves for a firm.The subscripts 1,2,and 3 for the SRATC curves refer to different plant sizes.
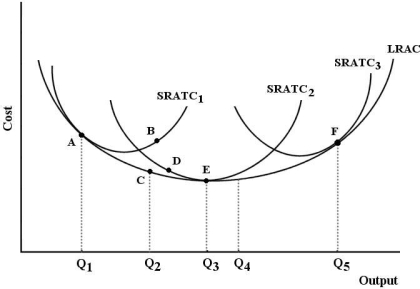 FIGURE 8- 3
-Refer to Figure 8- 3.If this firm is producing at point B,then
Definitions:
Related Questions
Q19: Assume an individual with a downward- sloping
Q21: Find the slope-intercept form of the equation
Q23: Suppose that capital costs $10 per unit
Q26: Refer to Figure 8- 6.At each of
Q30: Find the slope of the line. <br>Y
Q45: Refer to Figure 8- 4.The firm is
Q53: In the long run,decreasing returns to scale
Q66: Use a graphing utility to graph the
Q70: The effect of the imposition of a
Q93: Movement from one point to another along