Multiple Choice
The diagram below shows the demand and supply curves for refrigerators in Canada.
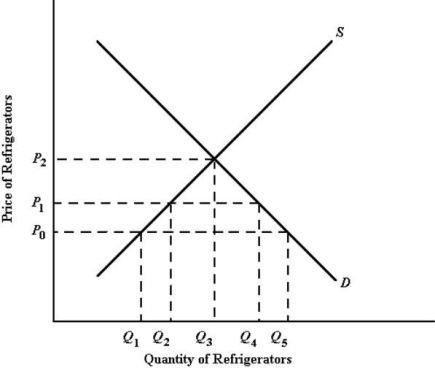 FIGURE 34- 1
-Refer to Figure 34- 1.The free- market equilibrium price of refrigerators in Canada is P0,implying that P0 is the
Definitions:
Related Questions
Q7: When a farmer in Manitoba produces fertilizer
Q17: What is a demogrant?<br>A)A social benefit that
Q17: An economist has data showing Canadian GDP
Q26: Refer to Table 7- 4.Marginal product of
Q33: A change in which of the following
Q54: In the short run,the firm's product curves
Q67: Refer to Table 17- 1.Suppose a public
Q80: Refer to Figure 34- 3.If the Canadian
Q86: The opportunity cost to a firm of
Q98: Refer to Figure 8- 4,with the isoquants