The diagram below shows a firm's demand for its units of capital-coin- operated coffee machines.The firm places its machines in universities and colleges across Canada.
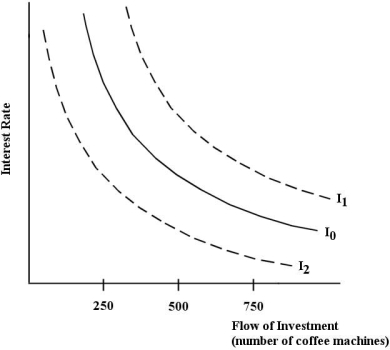 FIGURE 15- 1
-Refer to Figure 15- 1.One possible explanation for a shift of the firm's investment demand curve from I0 to I1 is
Definitions:
Document
A digital or physical record containing information or data, often formatted for reading or printing.
Data Labels
In charting and graphing, data labels are small pieces of text used to represent the value of a data point, slice, or bar in a chart or graph, making the data easier to understand at a glance.
Numerical Values
Data expressed in numbers, representing quantities, measurements, or statistical information.
Chart
A visual representation of data designed to make information easily understandable at a glance.
Q7: When a farmer in Manitoba produces fertilizer
Q7: In an oligopolistic industry,which of the following
Q13: Which of the following phenomena is NOT
Q19: One efficiency- based argument in favour of
Q36: For an entire economy,allocative efficiency requires that<br>A)price
Q73: The excess burden of a tax reflects
Q76: Suppose that you lend me $100 for
Q82: A profit- maximizing monopsonist in a labour
Q86: Suppose we have a labour market with
Q102: Suppose there are many independent dry cleaners