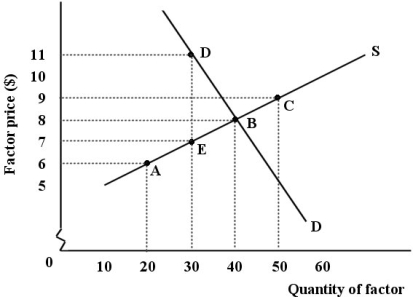
FIGURE 13- 3 The demand and supply curves shown below apply to a competitive market for a factor used in the production of widgets.

-Refer to Figure 13- 3.If the supply and demand curves for the factor are as shown in the diagram,but the wage being paid is $9,and the market is at point C,
Definitions:
Microeconomics
studies the behavior of individuals and firms in making decisions regarding the allocation of limited resources.
Macroeconomics
The branch of economics that studies the behavior and performance of an economy as a whole, focusing on total national income, employment, and price levels.
Equilibrium Price
The price at which the quantity of a good or service supplied is equal to the quantity demanded, resulting in market balance.
Economics
The social science that studies the production, distribution, and consumption of goods and services.
Q18: Refer to Table 15- 2.What principle will
Q27: Between 1990 and 2009,Canada's greenhouse gas emissions
Q35: All of the following are examples of
Q39: Suppose a firm producing roof shingles imposes
Q45: The average revenue curve for a single-
Q54: Refer to Figure 16- 3.Assume there are
Q54: Refer to Table 13- 2.This firm begins
Q76: One difference between a perfectly competitive market
Q83: Advertising by existing firms in an oligopolistic
Q96: In the context of government intervention in