The diagram below shows the demand and supply curves in a perfectly competitive market.
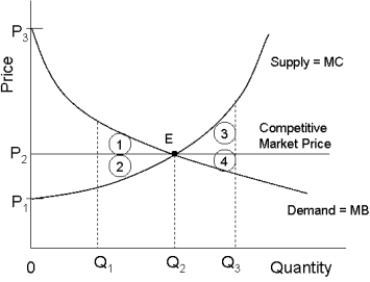 FIGURE 12- 5
-When comparing a monopoly equilibrium to a competitive market equilibrium,the consumer suffers two types of losses.They are
Definitions:
Q31: The following statements describe the adverse effects
Q43: If a single- price monopoly is presently
Q62: Refer to Table 14- 1.In a competitive
Q75: Refer to Figure 11- 2.Diagram C depicts
Q76: Consider Canadaʹs balance of payments.Suppose Canadaʹs current
Q90: A downward- sloping marginal benefit curve for
Q91: All Canadian provincial governments have legislated minimum
Q92: Refer to Figure 12- 6.Suppose this firm
Q95: An economy will be allocatively efficient if<br>A)the
Q114: Suppose Canada has a flexible exchange rate.If