The diagram below shows the market demand curve and the cost curves for a single firm.
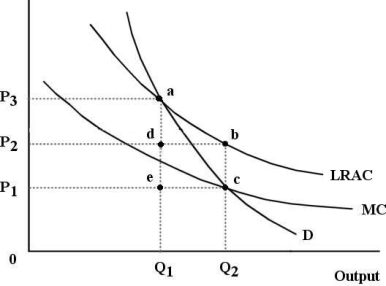 FIGURE 12- 6
-Refer to Figure 12- 6.Suppose this firm is being regulated using the policy of marginal- cost pricing.The resulting price and output would be
Definitions:
Average Variable Cost
The cost per unit of production that varies with the level of output, calculated by dividing the total variable costs by the number of units produced.
Variable Costs
Expenses that change in proportion to the activity of a business, such as costs for raw materials or production inputs.
Fixed Costs
Costs that do not vary with the level of production or sales, such as rent, salaries, and insurance premiums.
Marginal Revenue
The additional income generated from selling one more unit of a good or service.
Q15: Which of the following roles of the
Q16: Consider a small firm that is producing
Q21: Suppose that a regional health authority is
Q45: The textbook presentation of present value involves
Q56: How much would you have to deposit
Q78: Chantal has a full- time job as
Q95: Refer to Figure 14- 5.Suppose this labour
Q96: Refer to Figure 13- 1.Which point shows
Q114: Refer to Table 11- 1.The eight- firm
Q183: Many of the worldʹs industrialized countries initially