The diagram below shows the market demand curve and the cost curves for a single firm.
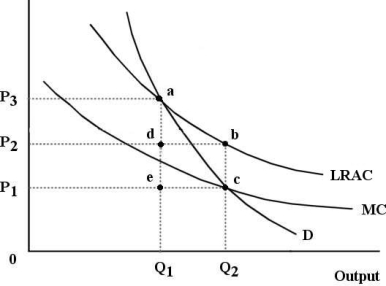 FIGURE 12- 6
-Refer to Figure 12- 6.Suppose this firm is being regulated using a policy of marginal- cost pricing.In this case,the firm would experience represented by the area .
Definitions:
Net Exports
The value of a country's total exports minus its total imports, a critical component of a nation's gross domestic product (GDP).
Saving
The act of setting aside a portion of current income for future use, typically by depositing money in savings accounts or investing in securities.
Diminishing Returns
The decrease in the marginal (incremental) output of a production process as the amount of a single factor of production is incrementally increased, keeping all other factors constant.
Foreign Portfolio Investment
Investment in financial assets from another country, such as stocks or bonds, which does not provide the investor with direct control over the assets.
Q9: Suppose that a professional association strengthened the
Q22: If a country is exporting more goods
Q37: In Canada in 2011,the share of total
Q50: All points on a country's production possibilities
Q54: Refer to Table 13- 2.This firm begins
Q63: Over the past four decades,Canada's non- residential
Q67: A monopolistically competitive firm has some degree
Q70: Given the continuing decline in manufacturing's share
Q139: Suppose that in Canada we experience a
Q178: Consider the following statement: ʺCanada is unambiguously