The diagram below shows selected cost and revenue curves for a firm in a monopolistically competitive industry.
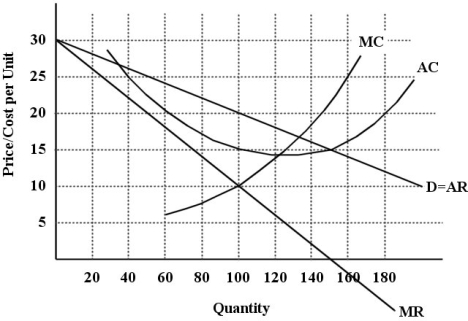 FIGURE 11- 1
-Refer to Figure 11- 1.Assuming that this firm is producing its profit- maximizing level of output,what are the profits or losses being earned by this firm?
Definitions:
Ambrosia
In Greek mythology, ambrosia is considered the food or drink of the gods, often depicted as conferring longevity or immortality upon whoever consumed it.
Fixed Coefficients
A term used in production and economics to describe technologies where inputs are used in strict fixed proportions to produce an output.
Production Possibility Set
A graph or curve depicting all maximum output possibilities for two or more goods, given a set of inputs.
Marginal Rate of Substitution
The rate at which a consumer is willing to give up one good in exchange for another, while keeping the overall satisfaction or utility constant.
Q23: Consider an ordinary rivalrous good,provided in a
Q34: A major aim of Canadian competition policy
Q46: In what way can an oligopolistic market
Q60: Consider the market for commercial ovens as
Q61: Which of the following is the result
Q106: A homeowner decides to buy three large
Q116: The effect of imposing a tariff on
Q128: Suppose Canada reduces a tariff on imported
Q131: A Canadian traveling to the United States
Q185: According to the principle of ʺnational treatmentʺ