Multiple Choice
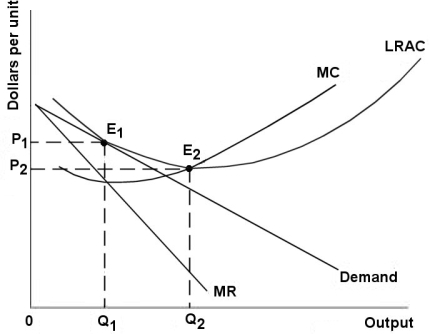
The diagram below shows demand and cost curves for a monopolistically competitive firm.
 FIGURE 11- 3
-Refer to Figure 11- 3.Which of the following is a demonstration of the excess- capacity theorem?
Definitions:
Related Questions
Q1: Refer to Figure 11- 3.If a decrease
Q5: Consider computer programmers as a factor of
Q7: Profit- maximizing firms increase production up to
Q47: Refer to Figure 12- 5.If output in
Q50: If Canadaʹs index of export prices is
Q57: Refer to Figure 13- 3.This factor market
Q76: The theory of equal net advantage is
Q112: Which of the following is the definition
Q197: For Canada,the term ʺexchange rate,ʺ as used
Q204: If the central bank pegs the exchange