Multiple Choice
The figure below shows the demand schedule and demand curve for a product produced by a single- price monopolist.
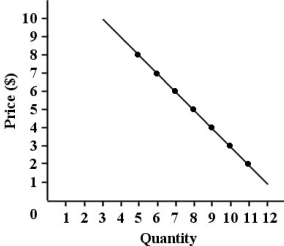 FIGURE 10- 1
-Refer to Figure 10- 1.What is the lowest level of output at which marginal revenue becomes negative?
Definitions:
Related Questions
Q4: If a monopolist's marginal revenue is MR
Q5: Assume exchange rates are flexible.When the quality
Q9: If a Canadian company builds and operates
Q21: Refer to Table 13- 3.The total revenue
Q23: Consider the market in which Canadian dollars
Q64: Refer to Figure 12- 7.Suppose this firm
Q65: Evidence suggests that some of the observed
Q71: Other things being equal,if it becomes more
Q85: Which of the following represents a typical
Q145: Refer to Figure 33-1.Suppose P0 is the