The diagram below shows the demand and supply curves for refrigerators in Canada.
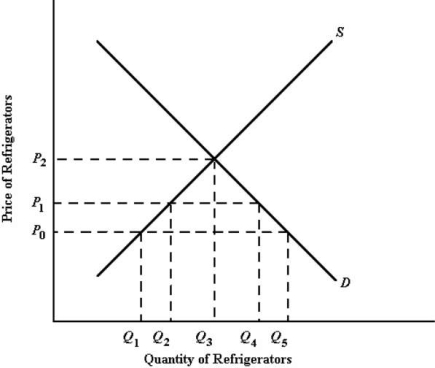 FIGURE 33-1
-Refer to Figure 33-1,and assume the world price is P0.The Canadian government now imposes an import quota of the amount Q2Q4.The result would be that the price in Canada would
Definitions:
Global Commodity Chain
A worldwide network of production and distribution processes through which a product passes until it reaches the consumer.
Rogue Agencies
Agencies that operate with disregard for laws or regulations, often pursuing their own agendas.
Bureaucratic Organizations
Organizations characterized by formal procedures, hierarchy, and a clear division of labor intended to increase efficiency.
Transnational Corporations
Large companies that operate and have assets or production facilities in more than one country, often exerting significant economic influence across national borders.
Q2: The economic variables that the Bank of
Q34: Refer to Figure 32-6.Assume the world price
Q55: An unemployed worker can be identified as
Q60: Consider the governmentʹs budget deficit function over
Q61: Monopolistic firms do not have supply curves
Q70: Suppose that a single- price monopolist
Q84: Which of the following products would most
Q85: Refer to Figure 10- 4.In order to
Q112: In mixed economies,economic behaviour is<br>A)largely determined by
Q182: What is potentially an important argument against