The table below shows various values of labour (L) ,capital (K) ,and technology (T) for Economies A,B,and C.In each case,the aggregate production function takes the following form:
Y = T × 
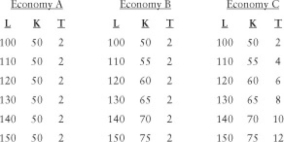 TABLE 25-4
-Refer to Table 25-4.The production function that applies to Economies A,B,and C displays
Definitions:
Q3: Suppose the NAIRU for Canada is 6.5%,the
Q44: Suppose the Canadian economy had an inflationary
Q51: Consider the basic AD/AS diagram.The vertical line
Q52: In macroeconomics,the consumption function<br>A)and the aggregate expenditure
Q59: As the macro economy adjusts from the
Q66: Consider the monetary transmission mechanism.Other things being
Q77: Which of the following statements is true
Q106: If we observe that the actual rate
Q107: Which of the following would likely cause
Q108: New theories of economic growth based on