The table below shows data for five economies of similar size.Real GDP is measured in billions of dollars.Assume that potential output for each economy is $340 billion.
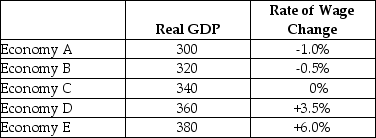 TABLE 24-1
-Refer to Table 24-1.Which of the economies is operating at its long-run equilibrium?
Definitions:
Inflation
A general increase in prices and fall in the purchasing value of money.
Monetary Growth
An increase in the money supply in an economy over time, which can influence inflation and economic activity.
Government Surplus
The situation where a government's income from taxes and other sources exceeds its expenditure over a specified period.
Keynesians
are economists or adherents of the economic theories of John Maynard Keynes, who advocated for government intervention in markets to mitigate the adverse effects of economic cycles.
Q5: Consider the simplest macro model with a
Q16: A movement along the net export (NX)function
Q29: The schedule that relates the level of
Q33: In the basic AD/AS macro model,it is
Q35: Suppose Canadian real GDP is currently equal
Q38: Debit cards that are issued by commercial
Q61: Consider two economies,A and B.Economy A has
Q85: Refer to Figure 25-2.Suppose national saving is
Q95: Consider the aggregate production function Y =
Q95: Consider the basic AD/AS macro model.A rise