The diagram below shows an AD/AS model for a hypothetical economy.The economy begins in long-run equilibrium at point A. 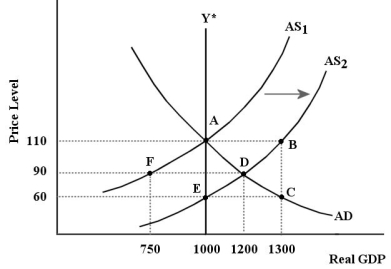 FIGURE 24-4
-Refer to Figure 24-4.After the positive aggregate supply shock shown in the diagram,which of the following would shift the AS curve leftward during the economy's adjustment process?
Definitions:
Total Fertility Rate
An estimate of the average number of children a woman will have during her reproductive years, typically used as an indicator of population growth.
Refined Birth Rate
A statistical measure of the number of live births in a year, typically expressed per 1000 people in the population, adjusted for specific criteria or demographics.
Demographic Transition
The process by which a country moves from high birth and death rates to low birth and death rates through stages of development, often leading to a stable or declining population.
Industrialization
The development of industries in a country or region on a wide scale, often marked by technological innovation and economic growth.
Q7: The decision by the Bank of Canada
Q19: Which of the following best describes the
Q20: A rise in domestic prices relative to
Q27: An output gap with Y < Y*<br>A)is
Q30: In the basic AD/AS macro model,the ʺparadox
Q36: Consider the basic AD/AS model.When wage rates
Q37: Desired consumption divided by disposable income is
Q71: Which of the following is an equivalent
Q86: An adjustment ʺasymmetryʺ in aggregate supply is<br>A)the
Q92: An exogenous fall in the domestic price