The figure below shows the marginal benefit to consumers,MB,the marginal cost to private firms,MCP,and the marginal cost to society,MCS,at each level of output of some good.
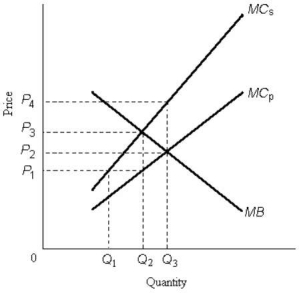 FIGURE 17-1
-Refer to Figure 17-1.The price that leads consumers to demand the socially optimal quantity of output is
Definitions:
Product Price
The amount of money charged for a product or service, determined by factors such as cost of production, market demand, and competition.
Curve Steepness
The rate at which the slope of a curve increases or decreases, often used in economics to describe the sensitivity of one variable to another.
Maximizes Profits
The process or strategy whereby a firm adjusts its production and pricing to achieve the highest possible profit.
Average Total Cost
Average total cost is calculated by dividing the total cost of producing a given output level by the quantity of output, reflecting the average cost per unit of output produced.
Q5: The government has seatbelt and airbag requirements
Q5: Consider the following information for a regional
Q6: When calculating GDP from the expenditure side,Ga
Q15: In which of the following situations would
Q15: Refer to Table 20-4.When calculating GDP from
Q22: If nominal national income increased by 10%
Q34: Refer to Figure 12-6.Suppose this firm is
Q37: If one Canadian dollar can be exchanged
Q84: Refer to Figure 17-7.Suppose that a system
Q103: Suppose a Canadian Member of Parliament suggests