The diagram below shows the marginal cost of pollution abatement for two firms,Firm X and Firm Y.
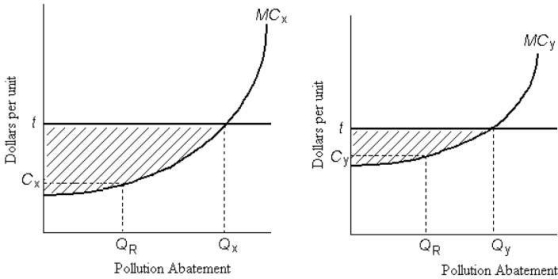 FIGURE 17-6
-Refer to Figure 17-6.There is an emissions tax of $ t per unit of pollution.Which of the following statements regarding the pollution abatement activities by the two firms is correct?
Definitions:
Q1: The construction of the TransCanada highway is
Q8: An example of a common-property resource is<br>A)a
Q10: The price level is measured in some
Q11: An efficient level of provision of a
Q23: In an imperfectly competitive market,changes in market
Q36: Consider the consumption function in our macro
Q66: In a competitive market economy with no
Q82: When an external cost associated with the
Q91: Suppose the unemployment rate is 8.5% and
Q97: Total value added in an economy is