The diagram below shows the supply and demand diagrams for the competitive market for honey in one region.MC0 represents private marginal cost and MB0 represents private marginal benefit.
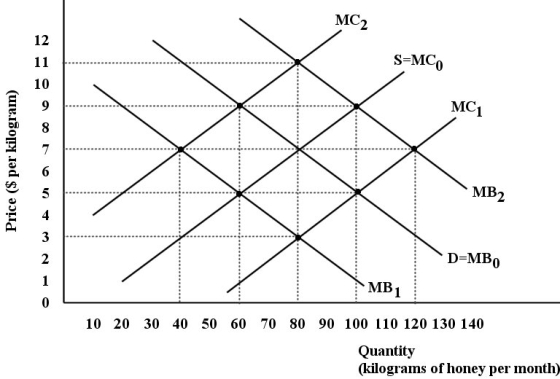 FIGURE 16-3
-Refer to Figure 16-3. Assume there are two types of firms in this region - beekeepers that produce honey and orchard keepers that produce peaches. The bees provide a benefit to the orchard keepers by pollinating their peach trees. We can say that there is a ________ externality in the production of honey. The curve ________represents the ________ marginal benefit of honey.
Definitions:
Buyer
A person or organization that purchases goods or services.
Law Of Demand
The economic principle stating that, all else being equal, as the price of a good or service decreases, consumer demand for it will increase, and vice versa.
Quantity Demanded
The quantity demanded is the amount of a good or service that consumers are willing and able to purchase at a given price, holding all else constant.
Price
The amount of money required to purchase a good, service, or asset, often influenced by factors like supply and demand.
Q8: Consider labour hired for $18 per hour.If
Q15: A single-price monopolist is currently producing an
Q18: If an industryʹs demand conditions allow at
Q29: Oligopolists make decisions after taking into account
Q32: Which of the following would be least
Q47: The most common measure of productivity is
Q48: Refer to Table 19-1 What is the
Q52: Suppose a cell-phone service provider has monopoly
Q61: Which of the following statements about the
Q66: Which of the following statements about single-price