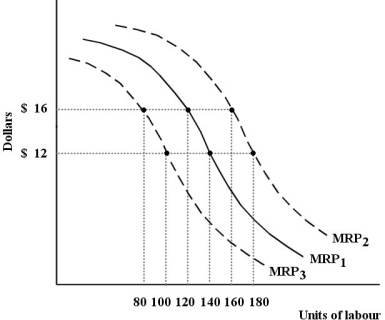
The diagram below shows the MRP curve for a firm producing copper plumbing pipe.The factor of production being considered here is hours of labour.
 FIGURE 13-1
-Refer to Figure 13-1.Suppose this firm is facing MRP1,a wage rate of $12 per hour and is employing 150 units of labour.At this level of employment,
Definitions:
Q22: Suppose there are only two firms in
Q22: Suppose a firm is using 1500 units
Q26: Suppose we have a labour market with
Q28: When a firm seeks to minimize costs
Q34: When a cost-minimizing firm is faced with
Q41: An example of a regressive tax in
Q43: An important defence of oligopoly as a
Q92: Consider a product (say,tulip bulbs)that generates positive
Q109: When designing a policy to reduce polluting
Q112: Suppose Canadaʹs exchange rate with the U.S.