The diagram below shows the MRP curve for a firm producing copper plumbing pipe.The factor of production being considered here is hours of labour.
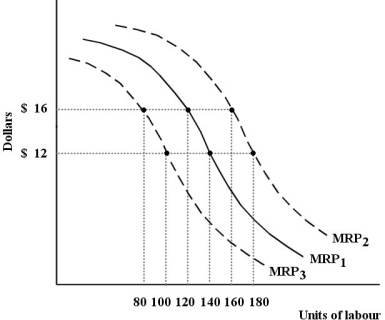 FIGURE 13-1
-Refer to Figure 13-1.Suppose this firm is facing MRP1,a wage rate of $16 per hour and is employing 100 units of labour.At this level of employment,
Definitions:
Connection
The feeling of being emotionally linked or bonded with someone, often seen as foundational to therapeutic relationships.
Stereotypical Roles
Traditional or clichéd societal expectations and behaviors assigned to individuals based on their gender, race, or social status.
Cultural Appropriation
The adoption or use of elements of one culture by members of another culture, often without understanding or respecting the original cultural context.
Cultural Normalization
The process by which certain behaviors, values, or norms become integrated and accepted within a society or culture as standard or typical.
Q14: Refer to Figure 13-1.Suppose this firm is
Q35: Refer to Figure 16-2.Suppose that the marginal
Q52: The presence of significant scale economies in
Q56: Consider a monopsonistic labour market.One hundred units
Q59: Suppose a perfectly competitive industry is in
Q64: In a perfectly competitive labour market,all workers
Q74: The most important source of revenue for
Q81: Refer to Figure 17-5.Suppose each firm is
Q89: Refer to Figure 17-6.There is an emissions
Q132: If the demand curve faced by a