The diagram below shows the MRP curve for a firm producing copper plumbing pipe.The factor of production being considered here is hours of labour. 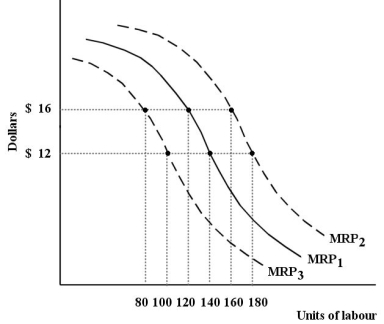 FIGURE 13-1
-Refer to Figure 13-1.This firm's MRP curve is the firm's
Definitions:
Price-Taker Market
A market condition where individual buyers or sellers have no power to influence the price of goods and services, typically due to high competition and standardized products.
Economic Profits
The difference between a firm's total revenues and its total opportunity costs.
Barriers to Entry
Economic, procedural, regulatory, or technological factors that obstruct or limit the possibility of new competitors entering an industry.
Long-Run Equilibrium
A state in which all factors of production and costs are variable, allowing firms to make adjustments and the market to stabilize at a point where supply equals demand.
Q7: Consider a small,remote town with only one
Q8: Consider the following equation: <br><img src="https://d2lvgg3v3hfg70.cloudfront.net/TB2891/.jpg" alt="Consider
Q25: Refer to Figure 18-4.What is the dollar
Q26: Consider a small firm that is producing
Q30: An economy will be allocatively efficient if<br>A)least-cost
Q31: Refer to Table 9-3.What is the marginal
Q42: When economists say that a firm is
Q63: If a regulatory agency imposes a lump-sum
Q86: Some important taxes are regressive,such as provincial
Q88: When a monopolistically competitive industry is in