The diagram below shows selected cost and revenue curves for a firm in a monopolistically competitive industry.
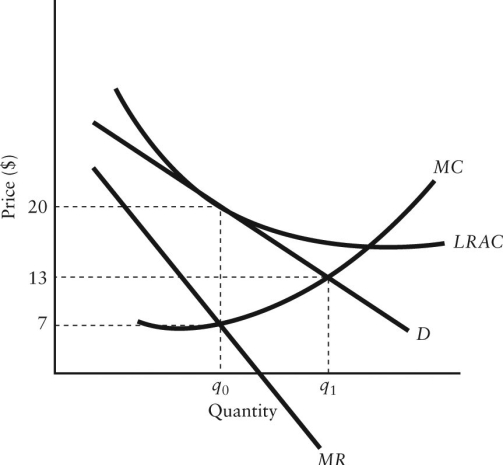 FIGURE 11-4
-Refer to Figure 11-4.How is the excess-capacity theorem demonstrated in this diagram?
Definitions:
Discussion Boards
Online platforms where individuals can post messages, share opinions, and discuss various topics in a structured or unstructured manner.
Multimedia Programs
Computer applications that use a combination of different content forms such as text, audio, images, animations, video, and interactive content.
Return on Investment
A financial measure used to evaluate the efficiency of an investment or compare the efficiency of multiple investments, calculating the return relative to the investment's cost.
Development Cost
Expenses associated with creating and implementing a training program, educational course, or new product.
Q4: The excess-capacity theorem predicts that<br>A)when price-taking firms
Q5: Suppose a cook at a diamond mining
Q6: Refer to Table 8-2.If capital costs $6
Q28: Refer to Figure 11-5.If Allstom and Bombardier
Q32: Which of the following products is best
Q48: The fact that isoquants are downward sloping
Q51: Which of the following concepts is most
Q70: Refer to Figure 12-6.Suppose this firm is
Q84: Refer to Figure 9-5.If Firm X is
Q108: Refer to Figure 13-2.This factor market is