The diagram below shows selected cost and revenue curves for a firm in a monopolistically competitive industry. 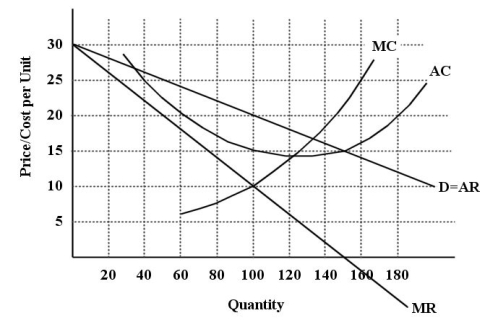 FIGURE 11-1
-Refer to Figure 11-1.If this firm is maximizing its profits,does the diagram depict a long-run equilibrium situation?
Definitions:
Self Competency
The ability to understand and manage one's own emotions, strengths, and weaknesses effectively in various situations.
Collectivism-group
A social pattern or philosophy that prioritizes the needs and goals of the group over individual desires.
Collective Distribution
The process of sharing or distributing something among a group in a coordinated manner.
GLOBE Model
A framework for studying and understanding the impact of culture on leadership and organizational practices across different nations.
Q3: Allocative efficiency is a property of the
Q7: Consider a small,remote town with only one
Q20: What is meant by the term ʺmarket
Q30: Natural barriers to firms to entering an
Q47: Suppose a labour union enters a competitive
Q53: In general,which of the following statements guides
Q72: Refer to Table 8-1.If the price of
Q81: A monopolist faces a straight-line demand curve
Q103: For firms in an oligopoly,the main advantage
Q121: Consider a coal-fired electric-power plant that is