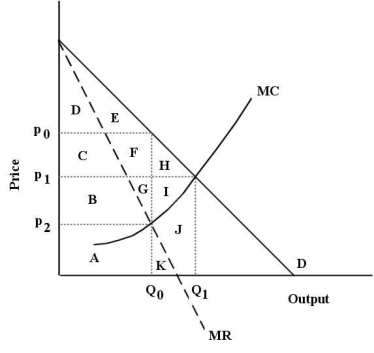
The diagram below shows the demand curve and marginal cost and marginal revenue curves for a new heart medication for which the pharmaceutical firm holds a 20-year patent on its production and sales.This protection gives the firm monopoly power for the 20 years of the patent.  FIGURE 10-6
-Refer to Figure 10-6.Assume this pharmaceutical firm charges a single price for its drug.At its profit-maximizing level of output,consumer surplus is represented by
Definitions:
Peek-a-boo
A classic game played with infants and young children, involving hiding and revealing one's face to entertain or surprise.
Low-fat Milk
Milk that has had a significant portion of its fat content removed, resulting in a product with reduced calories and fat.
Teenaged Patient
An individual in the teenage years (approximately 13-19 years old) who is receiving medical care or treatment.
Cigarette Use
The act of smoking tobacco contained in cigarettes, which is a well-documented risk factor for developing various diseases, including lung cancer.
Q12: Refer to Figure 12-7.If this firm were
Q28: An important unanswered question about the role
Q46: Refer to Table 8-2.Suppose capital costs $6
Q55: The substitution effect is<br>A)the change in quantity
Q66: Refer to Figure 11-1.Assuming this firm is
Q88: An example of debt financing for any
Q96: Why might it be economically efficient to
Q100: Refer to Table 7-3.At what level of
Q108: Consider a basket-producing firm with fixed capital.If
Q129: Consider a competitive industry in which firms