The figure below shows a family of cost curves for a firm.The subscripts 1,2,and 3 for the SRATC curves refer to different plant sizes.
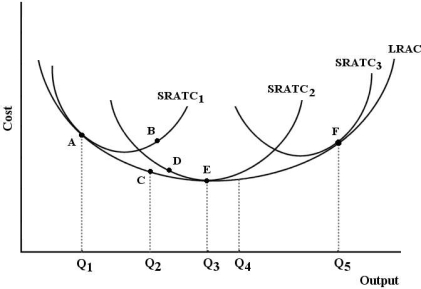 FIGURE 8-3
-Refer to Figure 8-3.The minimum efficient scale is achieved by this firm at output level
Definitions:
Monopolistic Competition
A market structure where many firms sell products that are similar but not identical, allowing for competitive pricing and product differentiation.
Creative Destruction
A concept in economics that describes the process by which new innovations replace outdated technologies and ideas, driving economic progress.
Concentrated Industries
Industries where a small number of firms dominate the market share, potentially leading to reduced competition and higher prices for consumers.
Innovative Firms
Companies that pioneer new ideas, technologies, or methods, leading to novel products or services and contributing to economic growth and competitiveness.
Q30: Refer to Figure 6-8.The movement of the
Q45: If the demand for some good fluctuates,but
Q54: A very-long-run consideration that could change a
Q64: Refer to Table 7-5.At what level of
Q76: Suppose a production function for a firm
Q77: Refer to Figure 11-3.A monopolistically competitive firm
Q81: Marginal utility theory is about<br>A)the consumer behaviour
Q81: An example of ʺrealʺ capital is<br>A)shares in
Q81: Any firmʹs average revenue is defined as<br>A)total
Q86: Normal goods<br>A)have positive income elasticity of demand.<br>B)have