The table below shows the approximate value of Canada's crude oil and natural gas exports over a 5-year period.The amounts shown are billions of dollars.
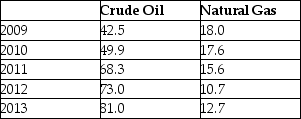 TABLE 2-7
-Refer to Table 2-7.Assume that 2009 is the base year,with an index number = 100.What is the percentage change in the value of exports of natural gas from 2009 to 2013?
Definitions:
Less Elastic
Describes a situation where a change in price leads to a relatively smaller change in the quantity demanded or supplied.
Market Segment
A group of potential customers who share similar needs or characteristics that a company targets with its products or services.
Earn Less Profit
A scenario where a business or individual generates a lower amount of financial gain from operations or investments.
Price Discrimination
A pricing strategy where identical or substantially similar goods or services are sold at different prices by the same provider in different markets or to different customers.
Q1: If the equilibrium price for some product
Q8: The major overall benefit of the BCG
Q9: Strategies clarify what can and cannot be
Q12: Strategy formulation requires coordination among a few
Q22: What percentage of McDonald's restaurants are actually
Q25: What does the following statement imply about
Q28: In free and competitive markets,surpluses are eliminated
Q31: In general,which of the following statements is
Q58: Which method of determining a firm's net
Q80: The limitations of a BCG Matrix include