Multiple Choice
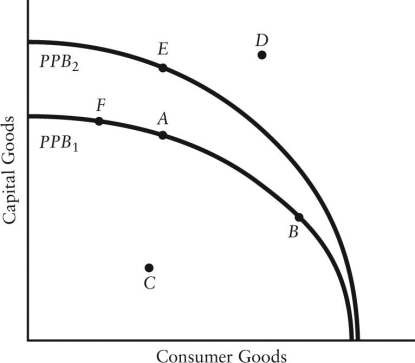
The diagram below shows two production possibilities boundaries for Country X.  FIGURE 1-4
-Refer to Figure 1-4.The production possibilities boundaries are drawn concave to the origin.What does this shape of the PPB demonstrate?
Definitions:
Related Questions
Q14: The relative price of a good<br>A)is always
Q27: If the total expenditure on photocopiers increases
Q27: An assertion about the desirability of reducing
Q56: How would Hershey's current divisional structure most
Q58: Consider an excise tax imposed on daily
Q63: Which of the following events would cause
Q67: Which variable would be considered part of
Q69: A normal good is one<br>A)that everyone normally
Q102: An economic system that relies primarily upon
Q111: If per capita income increases by 10%